Prometheus Overview
What is Prometheus ?
Prometheus is an open-source system monitoring and alerting toolkit that was originally built at SoundCloud. Currently, it is a standalone open-source project and is maintained independently of any company.
Prometheus collects metrics from targets by “scraping” metrics HTTP endpoints and stores the metrics as time-series data, i.e. metrics information is stored with the timestamp at which it was recorded, alongside optional key-value pairs called labels.
Metrics play an important role in understanding why your application is working in a certain way. Lets assume you are running a web application and find that the application is slow. You will need some information to find out what is happening with your application. For example the application can become slow when the number of requests are high. If you have the request count metric you can spot the reason and increase the number of servers to handle the load.
Prometheus Components and Architecture.
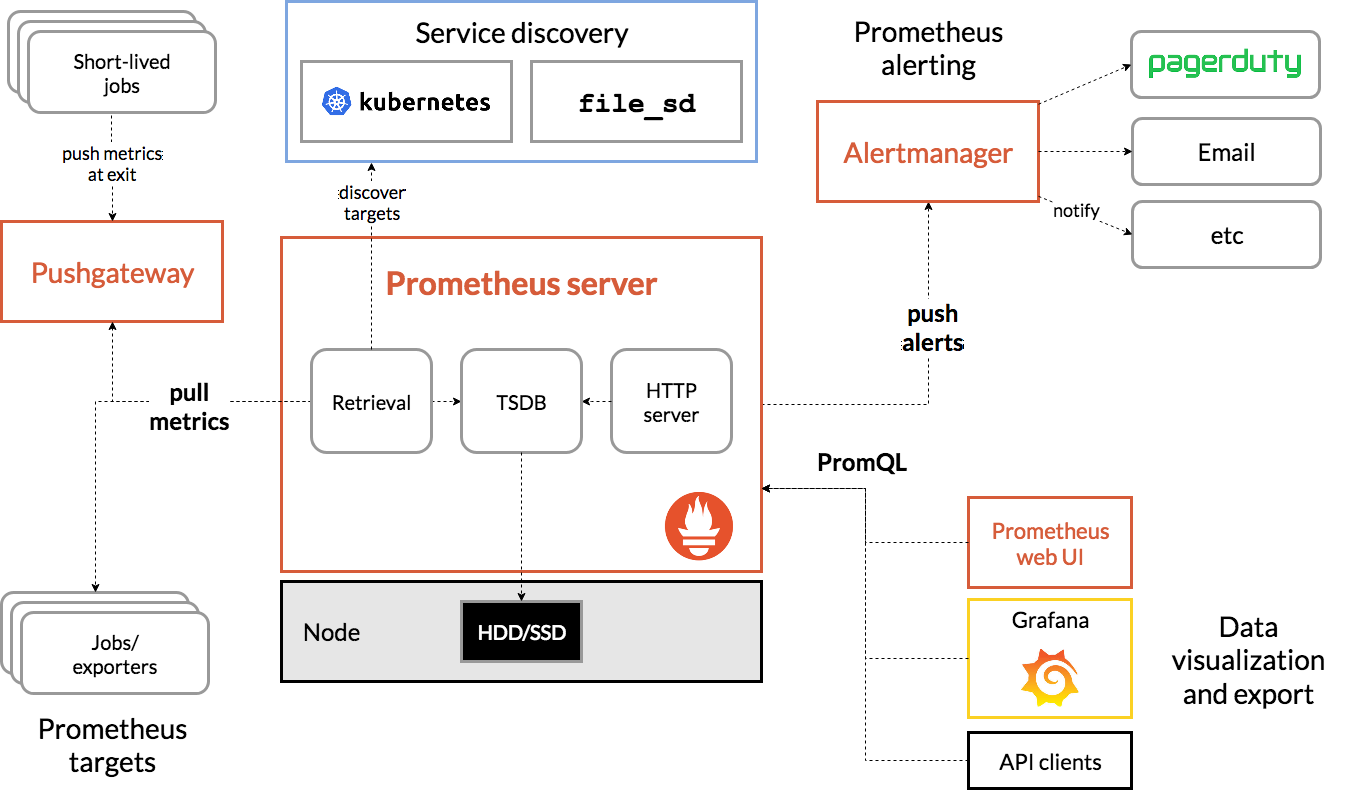
The Prometheus ecosystem consists of multiple components that work together to track and report on system health. Many of the components are optional. Essential components include:
This is the brain of the system. It handles scraping of metrics in the form of time series data from nodes and stores them. The server manages scheduling of monitoring jobs — querying data sources (called “instances”) at a predefined polling frequency. Monitoring jobs are configured via one or more “scrape config” directives, managed via a YAML configuration file which can be live-reloaded using a SIGHUP or the Management API.
Prometheus relies heavily on various service discovery (SD) mechanisms to identify targets to scrape. These service discovery integrations range from generic interfaces like a file-based service discovery that custom SD implementations can leverage by managing a JSON or YAML file containing a list of targets.
Prometheus also provides a number of platform-specific SD implementations, including: Kubernetes, AWS EC2, Azure, GCE, Docker Swarm, OpenStack, and more. These generally integrate with the corresponding APIs to query the platform for targets running applications and exporters that can be scraped by Prometheus.
2. Client libraries & Exporters :
In order for Prometheus to scrape metrics from a client it needs to be in a format Prometheus can understand. Time series formatted metrics do not typically spring forth from applications; usually, instrumentation that produces these types of metrics would have to be manually added. This can be done in two ways, depending on whether you control and can modify the source code for the application whose metrics you want sent to Prometheus.
In the case where you control the source code, with very few lines of code, you can define and add your desired metrics using Prometheus’ client libraries in a process called direct instrumentation. Client libraries handle all the essential details, such as bookkeeping or thread-safety, and sends out your metrics in a format that can be directly scraped by Prometheus.
In the case where you have no control over the source code, direct instrumentation is not an option. In this case, we use exporters. An exporter is comprised of software features that produce metrics data, and an HTTP server that exposes the generated metrics available via a given endpoint. Metrics are exposed according to a specific format that the Prometheus server can read and ingest (scraping).
Push Gateway is used to allow short lived jobs to expose their metrics to Prometheus. Since these kinds of jobs may not exist long enough for Prometheus to scrape them, they can instead push their metrics to a Push Gateway, which acts as kind of a metric cache, holding them long enough so they can be scraped by Prometheus.
The Prometheus Alertmanager allows you to define your own alerts on the collected metrics, so that you can be notified in case of any abnormalities or discrepancies in the data collected. The Alertmanager can be configured to group certain alerts of the same type, suppress certain alerts based on other alerts.
Most Prometheus components are written in Go, making them easy to build and deploy as static binaries.
5. Prometheus Web UI & Visualizations:
The Prometheus web app includes a built-in utility it describes as an “expression browser” which provides direct access to enter any expression and visualize its result either in a table or graphed over time. However, this is billed as primarily useful for ad-hoc queries and debugging — for actual graphs, Grafana or Prometheus Console templates are recommended.
Demo: Server Monitoring with Prometheus and Grafana.
For this demo we will be monitoring resource usage on a remote server.
Step 1: Install Exporter.
As mentioned in the overview we require an exporter to produce metrics data, and exposes the generated metrics available via a given HTTP server endpoint. To monitor a Linux host we will use Node Exporter.
The Prometheus Node Exporter can be run as a single static binary that you can install via tarball or running it using docker/docker-compose. In our case we will be using docker-compose.
The docker-compose file is defined as:
Running the compose file we get.


In our case we are running it on localhost if it was on a remote server we would use the remote server ip address instead. Since the port is exposed on the public internet we need to secure it so that we don’t show our metrics to malicious attackers. To do this we will be using htpasswd basic auth.
We can use it directlyhtpasswdTo generate bcrypt password hash.

Here we only use it to generate the password hash without passing the user name.
Next, we need to create a configuration file, node_exporter_conf.yaml, that will be used by node exporter to setup the username and password.
The node_exporter_conf.yaml cofiguration file is defined as:
After adding the config file we need to update the docker-compose-node-exporter.yaml file.
Updated compose file is defined as:
After running the updated compose file we have to enter the username (prometheus) and password (password) so as to view the metrics.


Note: More can be done to secure node exporter.
Step 2: Installing and configuring Prometheus.
There are various ways of installing Prometheus in our case we will be running it with docker-compose.
The docker-compose-prometheus.yaml file is defined as:
The prometheus configurations are being passed in the volume section of the compose file. The conf file is defined as:
In the configuration file we are passing the username and password for the node exporter. We are also specifying the targets which in our case is the node exporter we has earlier deployed.
After running the prometheus compose file we can view it on the browser.


So as to view the more metrics on a ‘prettier’ dashboard we will be using Grafana.
Step 3: Installing and Configuring Grafana.
We will be using docker-compose to run Grafana.
The docker-compose-grafana.yaml is define as:
After running the compose file we can login to the webui using the default username:admin and password:admin then change the login credentials.


changing password.


Inorder to create a dashboard we need to import the data from prometheus by createing a data source. This is done by selecting the data sources tab and selecting the correct data source type.
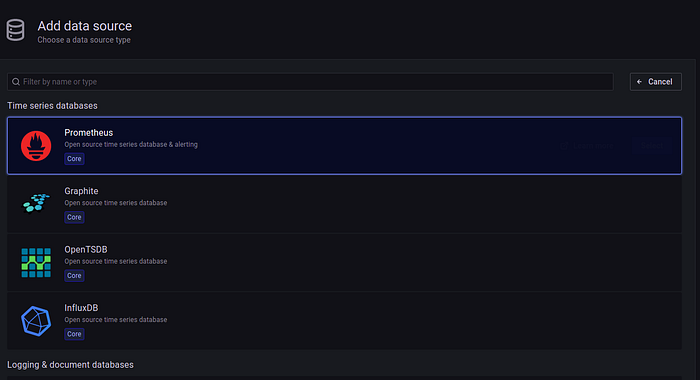
In our case we are using prometheus.

Fill in the correct details. Make sure you set correct url for prometheus and save.

Next we build the dashboard by clicking the plus sign on the left of the screen.

In Grafana you can import a dashboard from the community marketplace.

Once you get a dashboard that meets your needs you can import it by copying the code id and pasting it in the import field.


Once imported you will need to set the data source which you had earlier created.

After import you can now view your metrics on a dashboard.


Conclusion.
In this brief tutorial we’ve been able to cover what Prometheus is and how to deploy a simple Linux host monitoring dashboard with Prometheus and Grafana.
Configuration files: https://github.com/muokicaleb/Prometheus_Grafana_demo
References.
- https://sensu.io/blog/introduction-to-prometheus-monitoring#:~:text=Prometheus%20is%20a%20monitoring%20solution,%22scraping%22%20metrics%20HTTP%20endpoints.
- https://prometheus.io/docs/introduction/overview/
- https://www.metricfire.com/blog/what-is-prometheus/
- https://prometheus.io/docs/concepts/jobs_instances/
- https://prometheus.io/docs/prometheus/latest/management_api/
- https://prometheus.io/docs/instrumenting/clientlibs/
- https://www.metricfire.com/blog/what-is-prometheus/
- https://www.metricfire.com/blog/first-contact-with-prometheus/
- https://prometheus.io/docs/visualization/consoles/
- https://prometheus.io/docs/visualization/grafana/
- https://prometheus.io/docs/guides/node-exporter/
- https://developpaper.com/add-authentication-to-prometheus-node-exporter/